2024年5月,南京財經大學食品科學與工程學院湯曉智教授課題組在期刊Food Hydrocolloids(Q1,IF: 11)發(fā)表題為“Performance enhancing of saturated fatty acids with various carbon chain lengths on the structures and properties of zein films in alkaline solvents”的研究性論文。
本研究以氫氧化鉀堿性溶劑溶解玉米醇溶蛋白,并通過添加不同碳鏈長度的飽和脂肪酸(即癸酸、月桂酸、棕櫚酸),以評估脂肪酸和甘油對堿溶解體系中玉米醇溶蛋白膜的塑化與性能提升作用。首先將玉米醇溶蛋白溶于堿性溶劑中,然后在50℃下加入脂肪酸并攪拌使其溶解,最后加入甘油,得到均勻的成膜液。通過澆鑄法成膜后,對膜中玉米醇溶蛋白的相對脫酰胺程度、結構和性能進行了相關表征。該研究摒棄了關于玉米醇溶白膜報道中最常見的有機溶劑溶解法,為深入了解玉米醇溶蛋白塑化、開發(fā)無有機溶劑食品包裝提供參考。
研究亮點
1. 玉米醇溶蛋白膜是溶解在堿溶液中后通過澆鑄法制備的。
2. 脂肪酸通過破壞玉米醇溶蛋白的分子間相互作用來阻止玉米醇溶蛋白的快速聚集。
3. 癸酸降低了玉米醇溶蛋白在堿性溶劑中的脫酰胺。
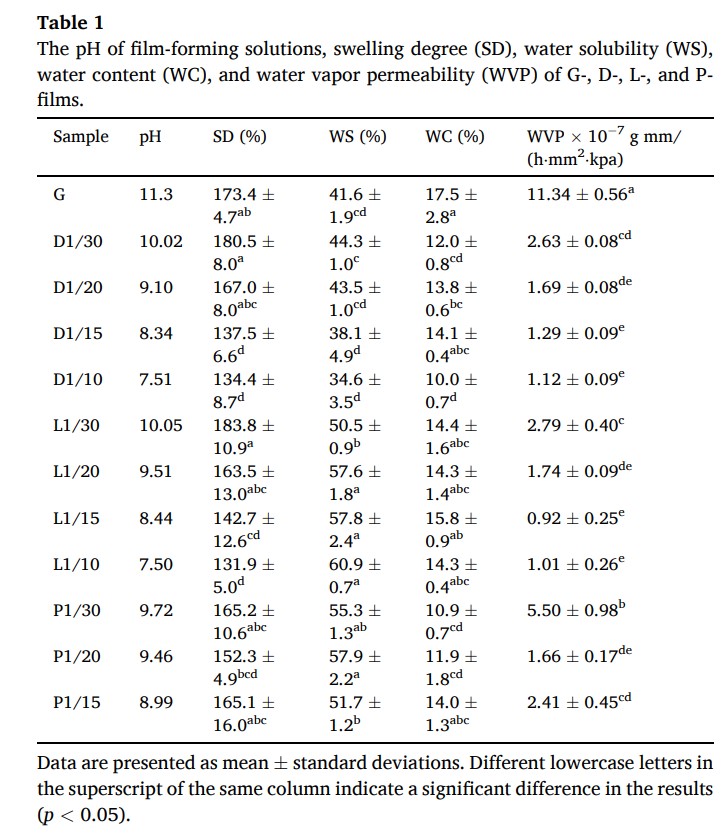
4. 在玉米醇溶蛋白中添加比例為1/15的癸酸或月桂酸可顯著提高玉米醇溶蛋白膜的性能。
研究結論
由于在堿性溶劑中的脫酰胺反應,玉米醇溶蛋白的結晶度在成膜后降低。SEM、XRD和FTIR分析結果表明,脂肪酸和玉米醇溶蛋白之間的相互作用降低了蛋白質分子的有序度,增加了玉米醇溶蛋白與甘油和堿性溶劑的相容性。這有助于減少玉米醇溶蛋白在成膜過程中的聚集,從而使薄膜具有致密的微觀結構。研究發(fā)現(xiàn),添加比例為玉米醇溶蛋白重量1/15的癸酸或月桂酸,可以獲得具備良好紫外線阻隔和可見光透射率,以及相對優(yōu)異的機械和水蒸氣阻隔性能的薄膜。這些信息將有助于減少使用有機溶劑開發(fā)玉米醇溶蛋白基的食品包裝薄膜。
圖文賞析
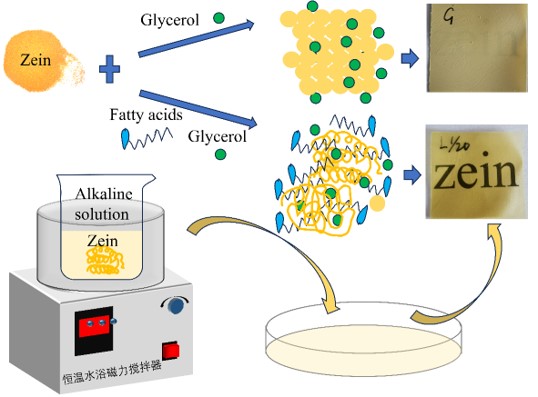
Figure 1 Schematic illustration for the zein films preparation.
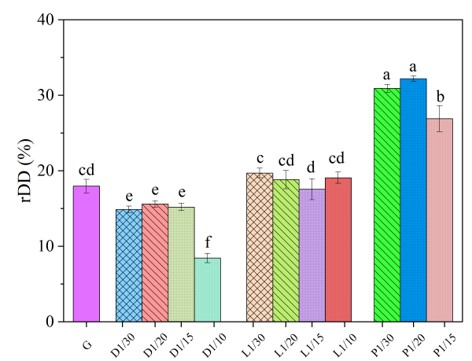
Figure 2 Relative deamidation degree of zein in films. D. L and P represent decanoic acid, lauric acid, and palmitic acid, respectively; and the number after the letter represents the ratio of fatty acids to zein. The content of glycerol in all membranes is 25% of zein, and G represents only glycerol.

Figure 3 SEM images of planes (A, C, and E, × 1000, scale bar = 100 μm) and cross-sections (B, D, and F, × 5000, scale bar = 20 μm) of D-, L-, P-, and G-films.
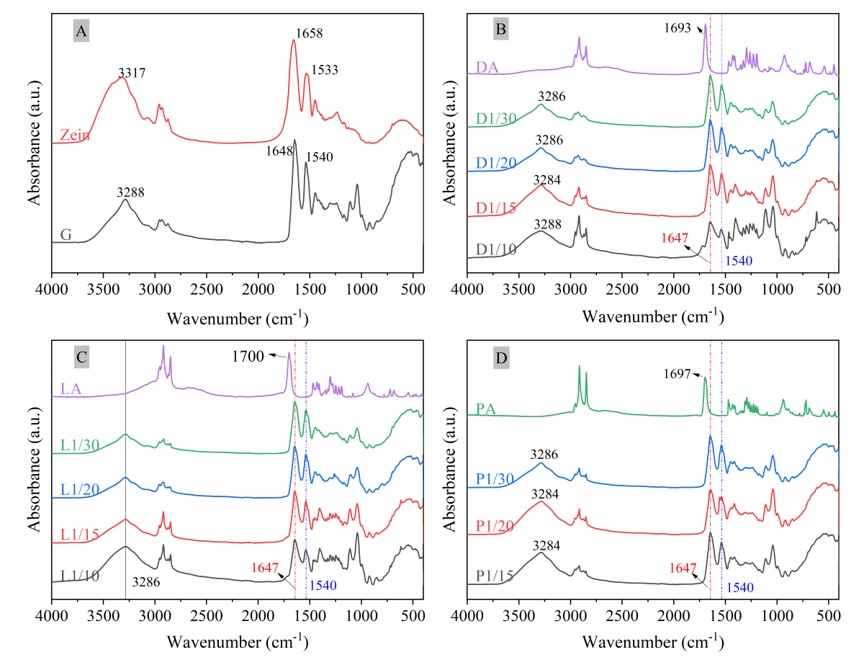
Figure 4 FTIR spectra of (A) Zein raw material and G-film, (B) DA and D-films, (C) LA and L-films, and (D) PA and P-films.
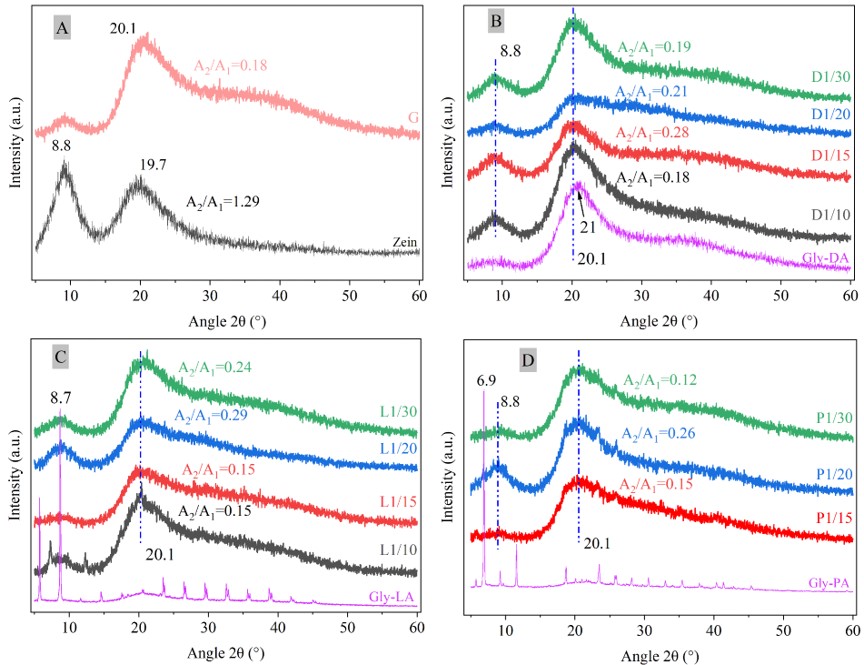
Figure 5 XRD patterns of (A) Zein raw material and G-film, (B) D-films, (C) L-films, and (D) P-films. Gly-DA, Gly-LA, and Gly-PA were dry mixtures that were consistent with the film-forming formulations of D1/15, L1/15, and P1/15, but do not contain zein. The A2/A1 was area ratios of 2θ = 8.8° (A2) and 2θ = 19.7–20.1° (A1).
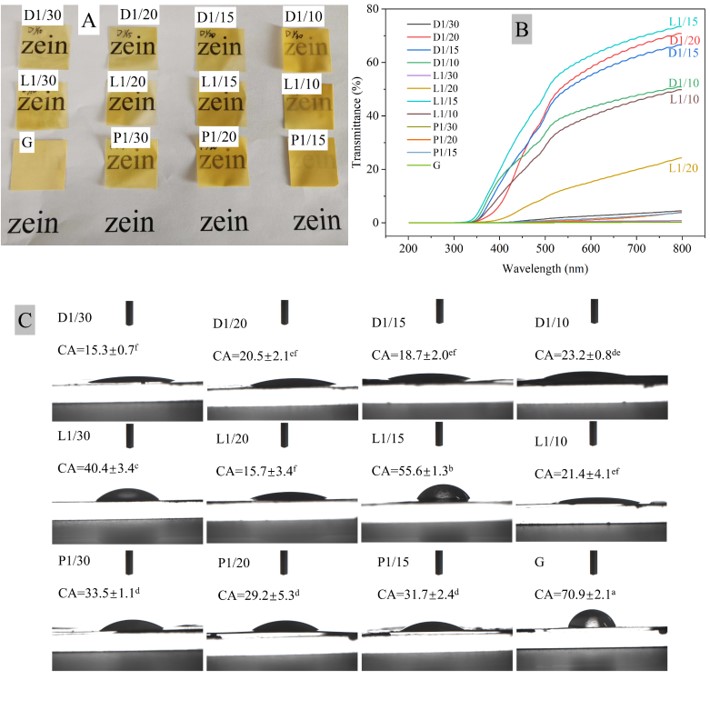
Figure 6 (A) Appearance, (B) light transmittance, and (C) contact angle of G-, D-, L-, P-films.
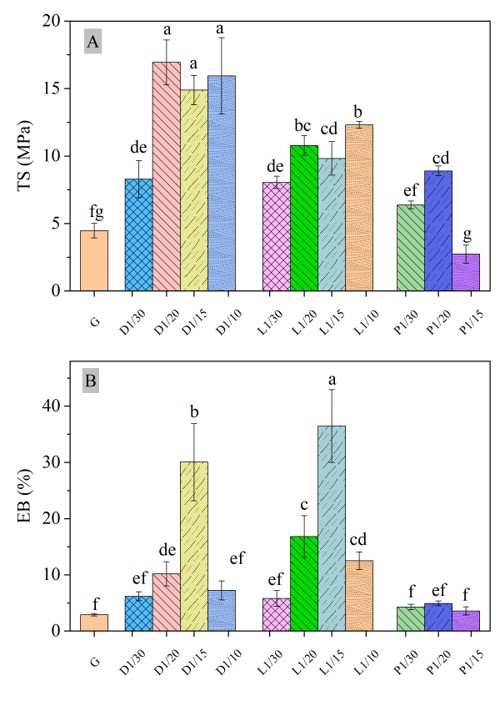
Figure 7 Tensile strength (A) and elongation at break (B) of G-, D-, L- and P-films.
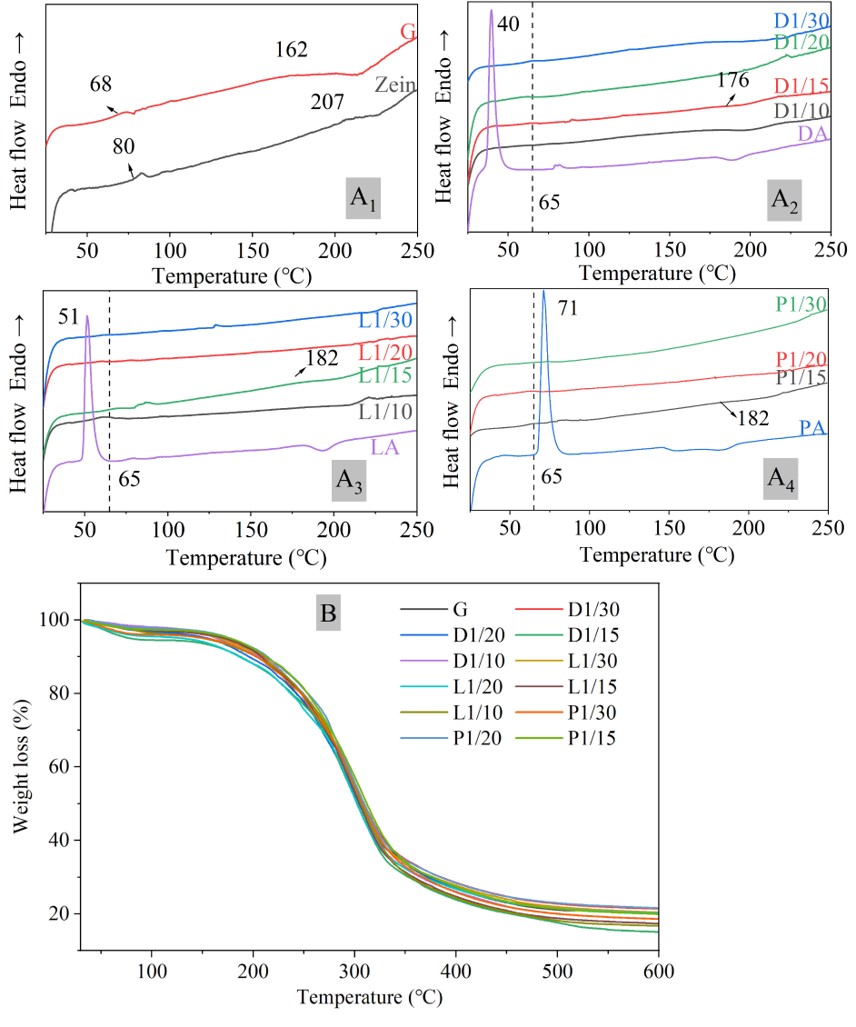
Figure 8 DSC curves of (A1) Zein raw material and G-film, (A2) DA and D-films, (A3) LA and L-films, A4) PA and P-films, and (B) TG ofG-, D-, L-, and P-films.
原文鏈接:https://doi.org/10.1016/j.foodhyd.2024.110214